On August 15, 1971, President Richard Nixon took the U.S. dollar off the gold standard. Overnight, money stopped being tied to a fixed amount of gold. The dollar became a fiat currency, backed by nothing except faith in the government. That single decision has profound consequences on our lives today: Prices tend to rise, assets like houses and stocks run ahead of paychecks, and saving takes more work.
This article explains what changed in 1971, why it matters now, and how to protect your finances in a world where cash steadily loses buying power. You can visit this website to see more data and visuals on the economic and societal changes that began in 1971.
The Bretton Woods System and Why Gold Mattered
To understand why 1971 was such a pivotal moment, we need to look back at the Bretton Woods System, the global monetary framework established after World War II. In this system, the U.S. dollar was pegged to gold at $35 per ounce and served as the global reserve currency. In other words, $100 could be exchanged for about three ounces of gold.
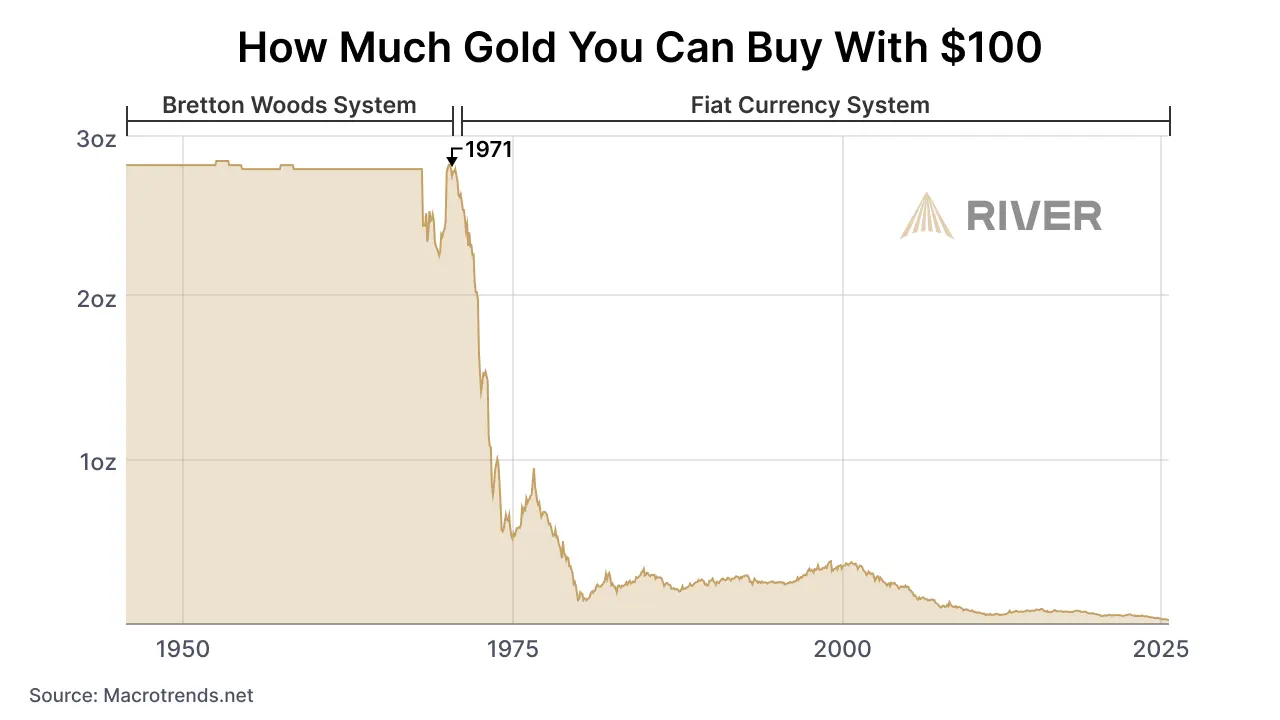
The system worked like this: foreign governments could exchange their dollar reserves for physical gold held by the U.S. Treasury. This convertibility created trust and stability in international trade. Countries held dollars because they were backed by gold, and exchange rates remained fixed.
Gold mattered because it imposed discipline on governments. They couldn’t simply print endless amounts of money; every dollar in circulation had to be backed by a specific amount of gold. This constraint helped keep inflation low, stabilized prices, and gave savers confidence that their money would retain its value over time. The gold standard was like a financial anchor, keeping currencies tethered to something real and scarce.
Why Nixon Ended the Gold Standard in 1971
By the late 1960s, cracks in the Bretton Woods system began to show. The U.S. was running large deficits to fund the Vietnam War and domestic programs, creating more dollars than it had gold to redeem. Countries like France began demanding gold in exchange for their dollars, draining U.S. reserves. The system was becoming unsustainable.
By the summer of 1971, the United States faced a full-blown monetary crisis. Foreign central banks were rapidly converting their dollar holdings into gold, exposing the fact that America no longer had enough gold to back all the dollars circulating globally. The U.S. gold stock had fallen by 50% in 25 years. If foreign governments kept demanding gold, the Treasury’s reserves could be depleted entirely.
Faced with a choice between dramatically tightening policy to defend the gold peg or breaking from the Bretton Woods system, President Richard Nixon chose the latter. On August 15, 1971, in a televised address, he announced the suspension of the dollar’s convertibility into gold. This effectively ended the international gold standard and ushered in the era of fiat money, where currency is backed not by a physical commodity but by government decree.
Nixon framed the decision as a temporary measure to protect the U.S. economy from “international money speculators,” but in reality, there was no going back. Attempts to negotiate a new system with fixed exchange rates quickly collapsed, and by 1973, major currencies were allowed to float freely against one another.
How the Financial System Changed After 1971
Everything about the financial system changed in 1971. The way people save and invest, the structure of the global economy, and the system’s underlying checks and balances were all reshaped in the new era of fiat money.
Two immediate consequences emerged after the U.S. left the gold standard:
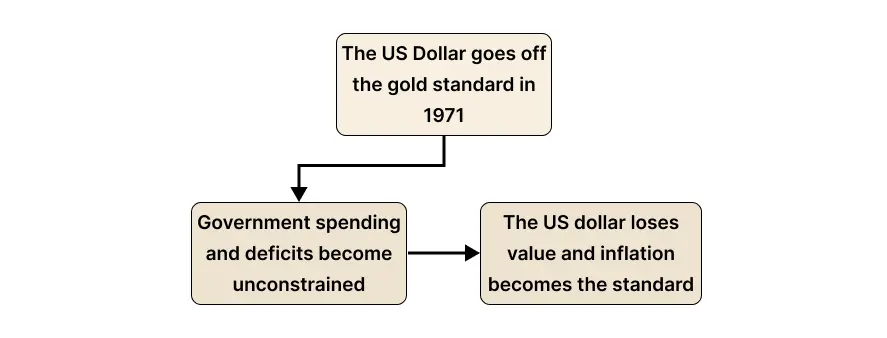
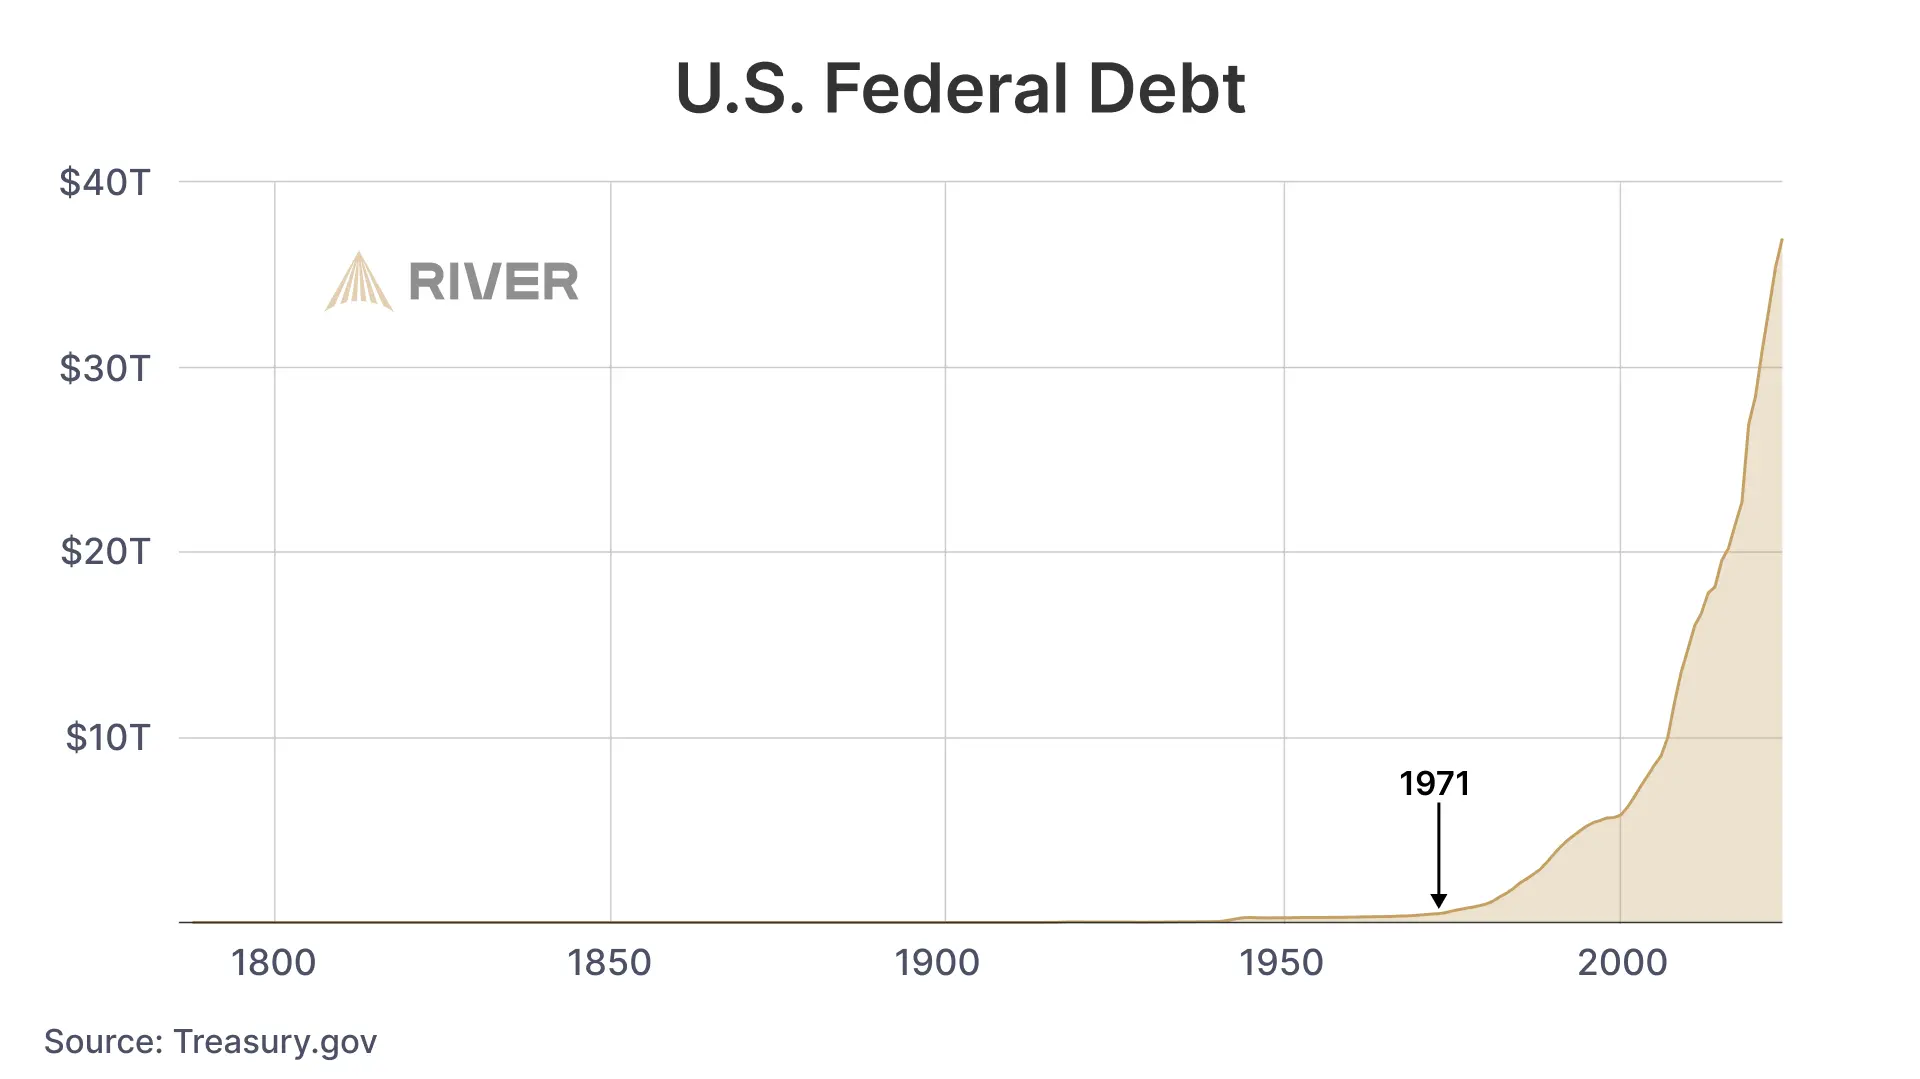
First, government spending was no longer constrained by gold reserves. Under the Bretton Woods system, the U.S. had to maintain the dollar’s peg to gold, which placed natural limits on how much money it could create and how large deficits could grow. Once the dollar became a fiat currency, those constraints disappeared. The government gained the ability to run persistent budget deficits, leading to a steadily rising national debt that continues to expand today.
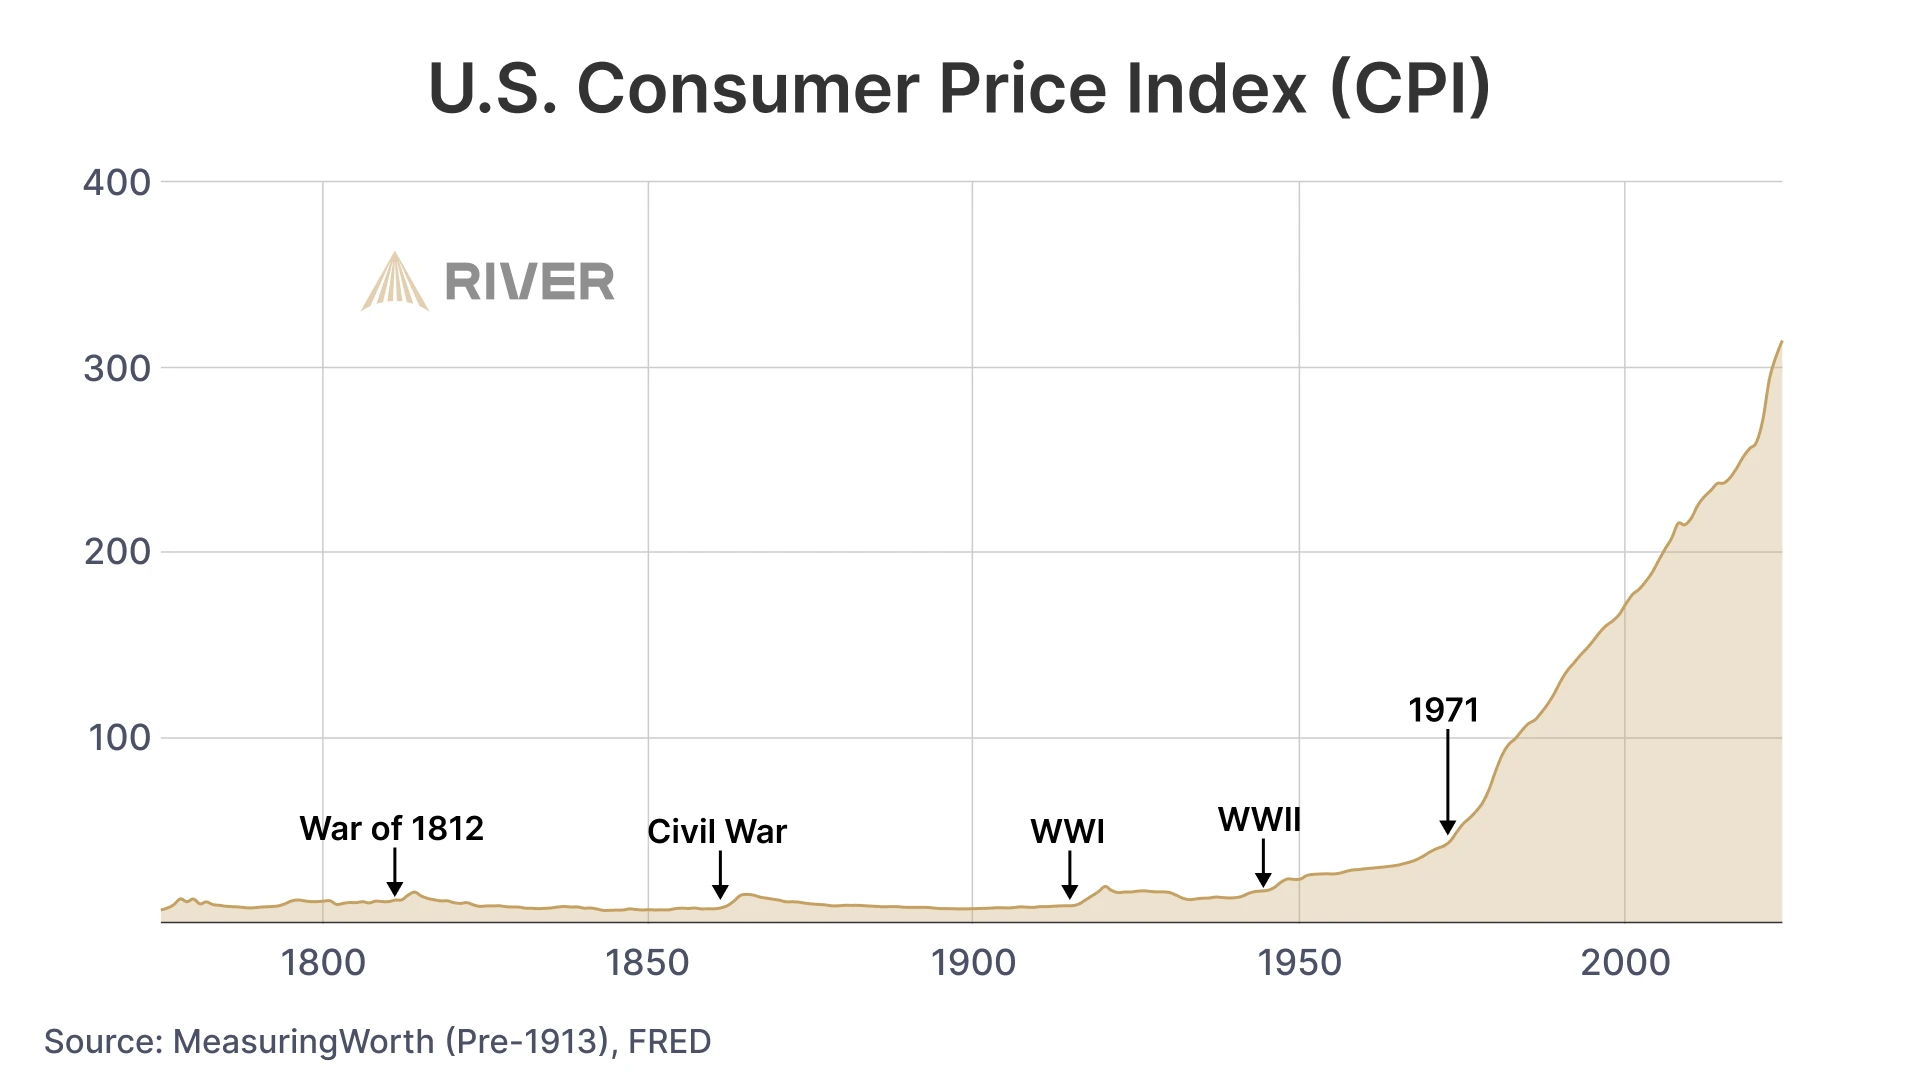
Second, without a fixed link to a scarce asset like gold, the dollar began to lose value over time. As government spending and the money supply increased, inflation became a permanent feature of the economic landscape. Prices rise year after year, and the purchasing power of the dollar steadily erodes.
The Long-Term Effects of a Fiat Currency System
More than 50 years have passed since Nixon closed the gold window, and the consequences of that decision are clear. This section explores how a fiat-based monetary system influences both the broader economy and the financial realities individuals face every day.
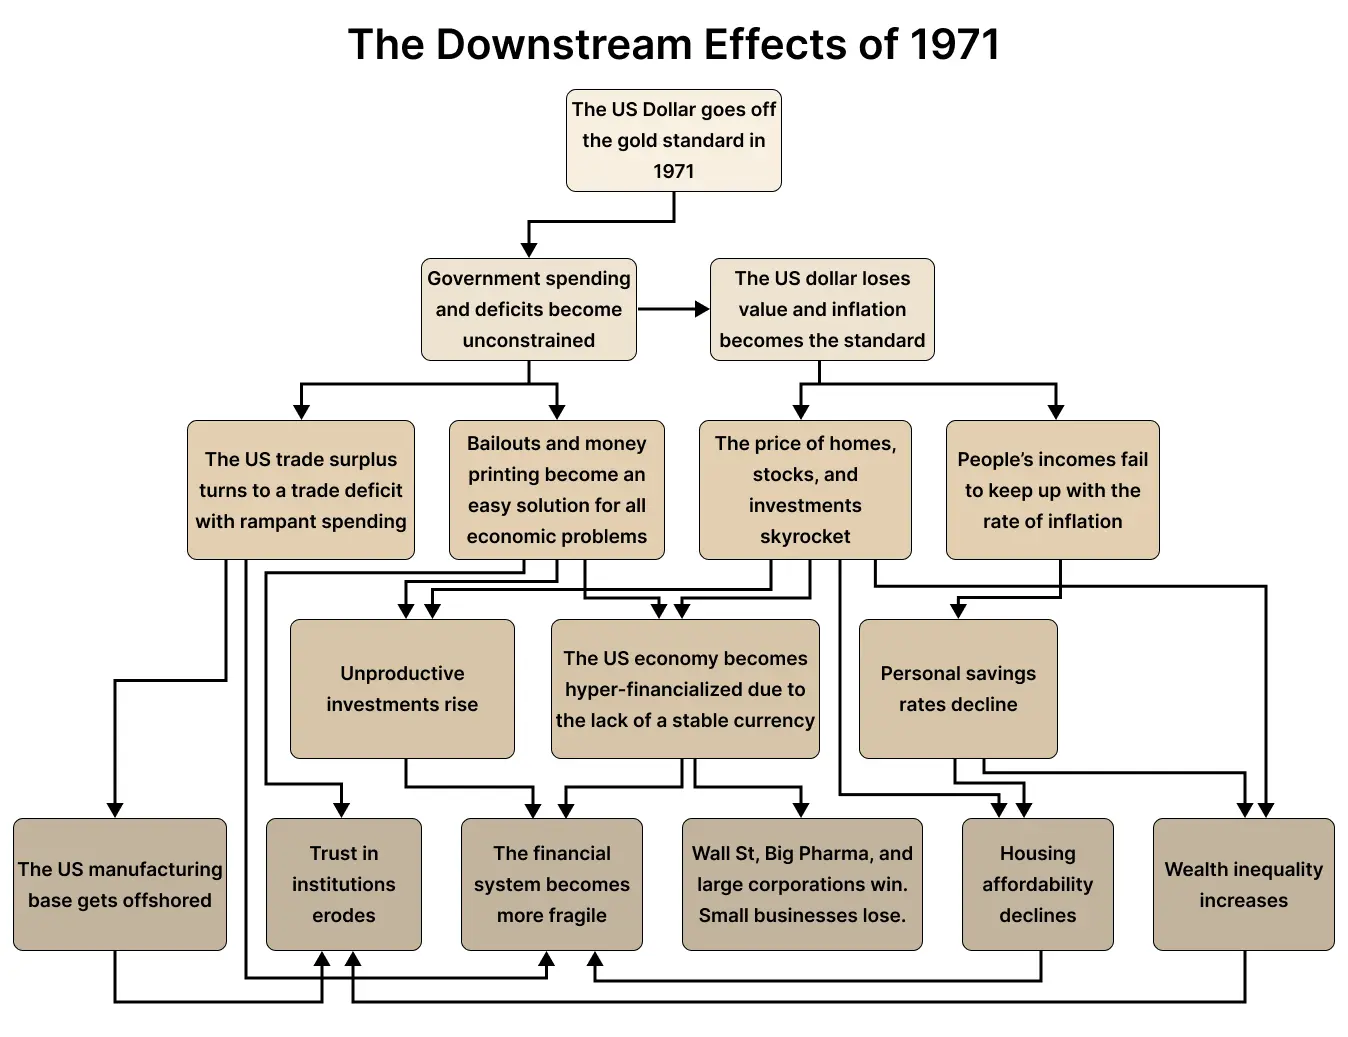
At the high level, a fiat currency system introduces economic distortions that continue indefinitely until the system is reset.
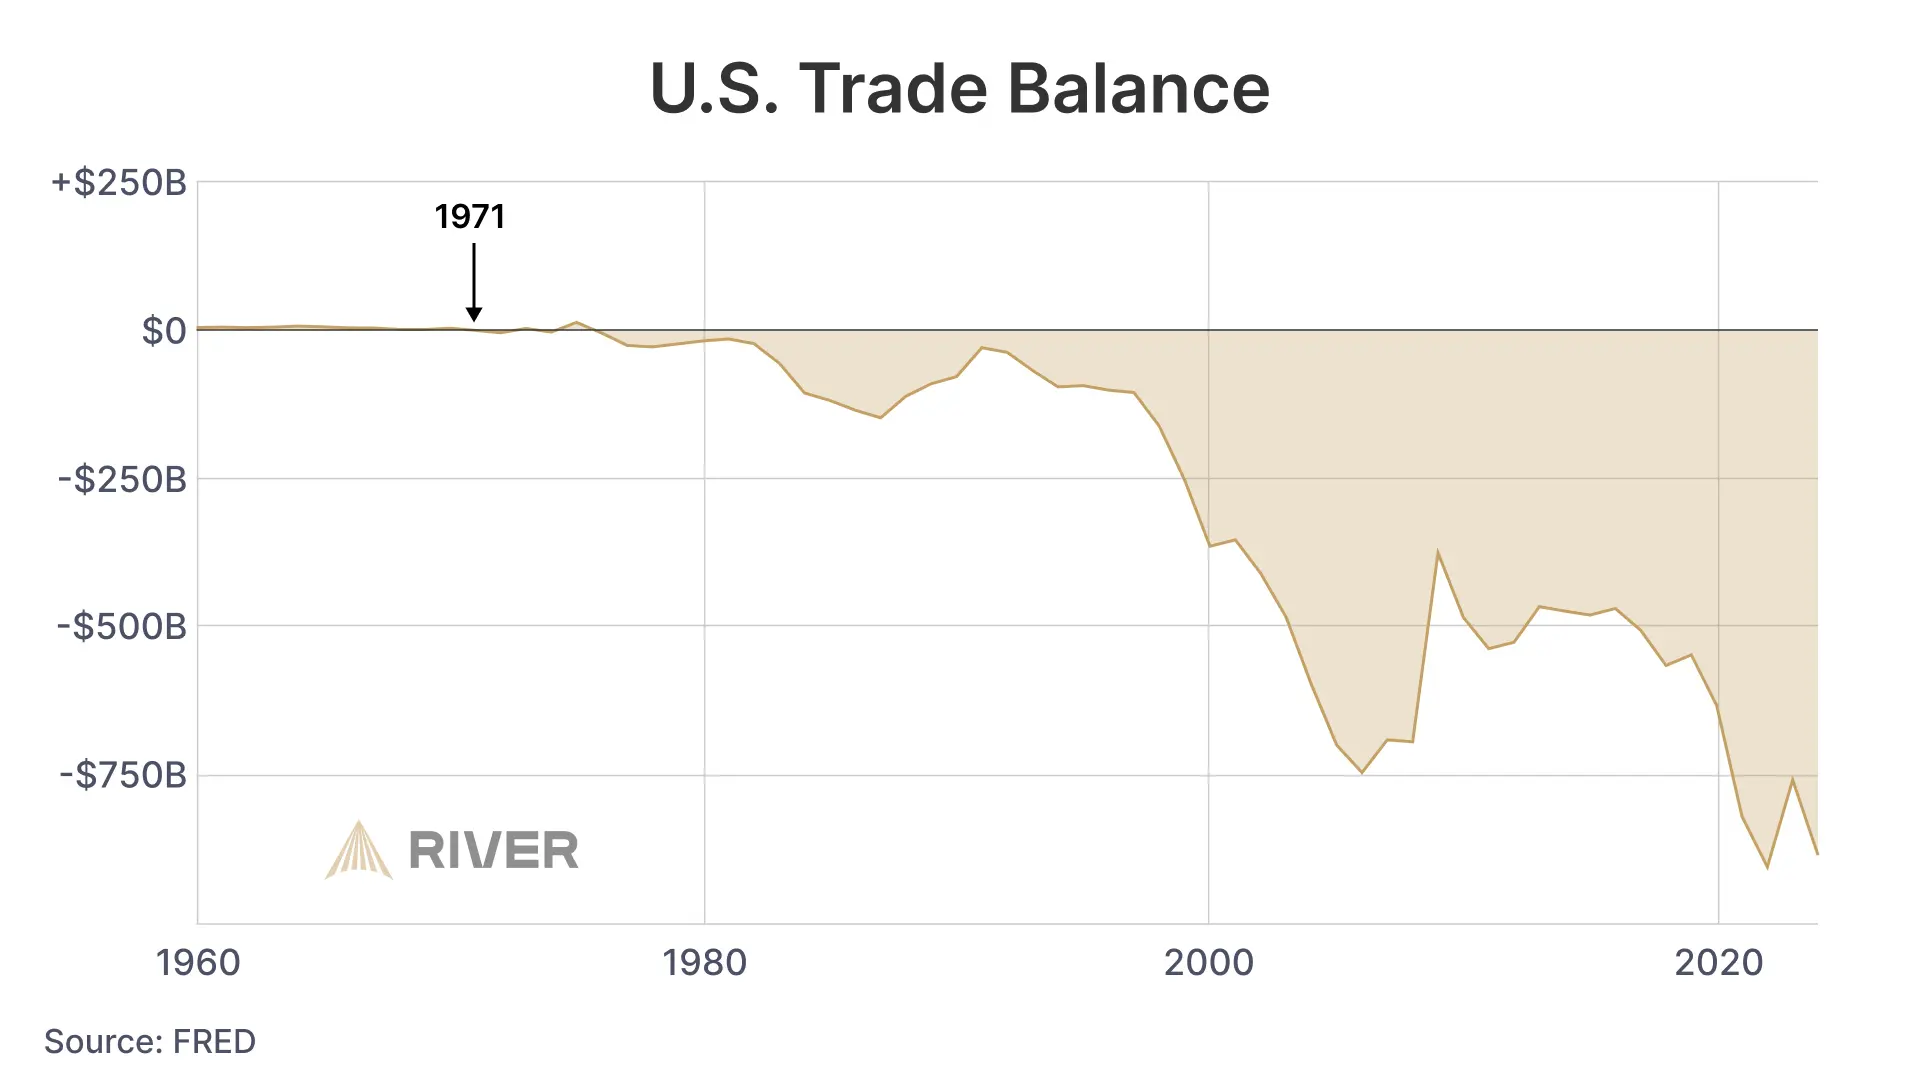
Once government spending was no longer bound by gold reserves, the U.S. economy began to spend more than it saved. This shift transformed the country from an export-driven powerhouse into a consumption-driven economy characterized by chronic trade deficits. Over time, America’s manufacturing base moved overseas as it became disproportionately cheaper, further deepening this structural imbalance.
Other economic distortions emerged through the rise of overspending and money printing. Without any hard limit on government spending, the default response to economic downturns became to inject more money into the system, whether through corporate bailouts, emergency programs, or large-scale fiscal expansion.
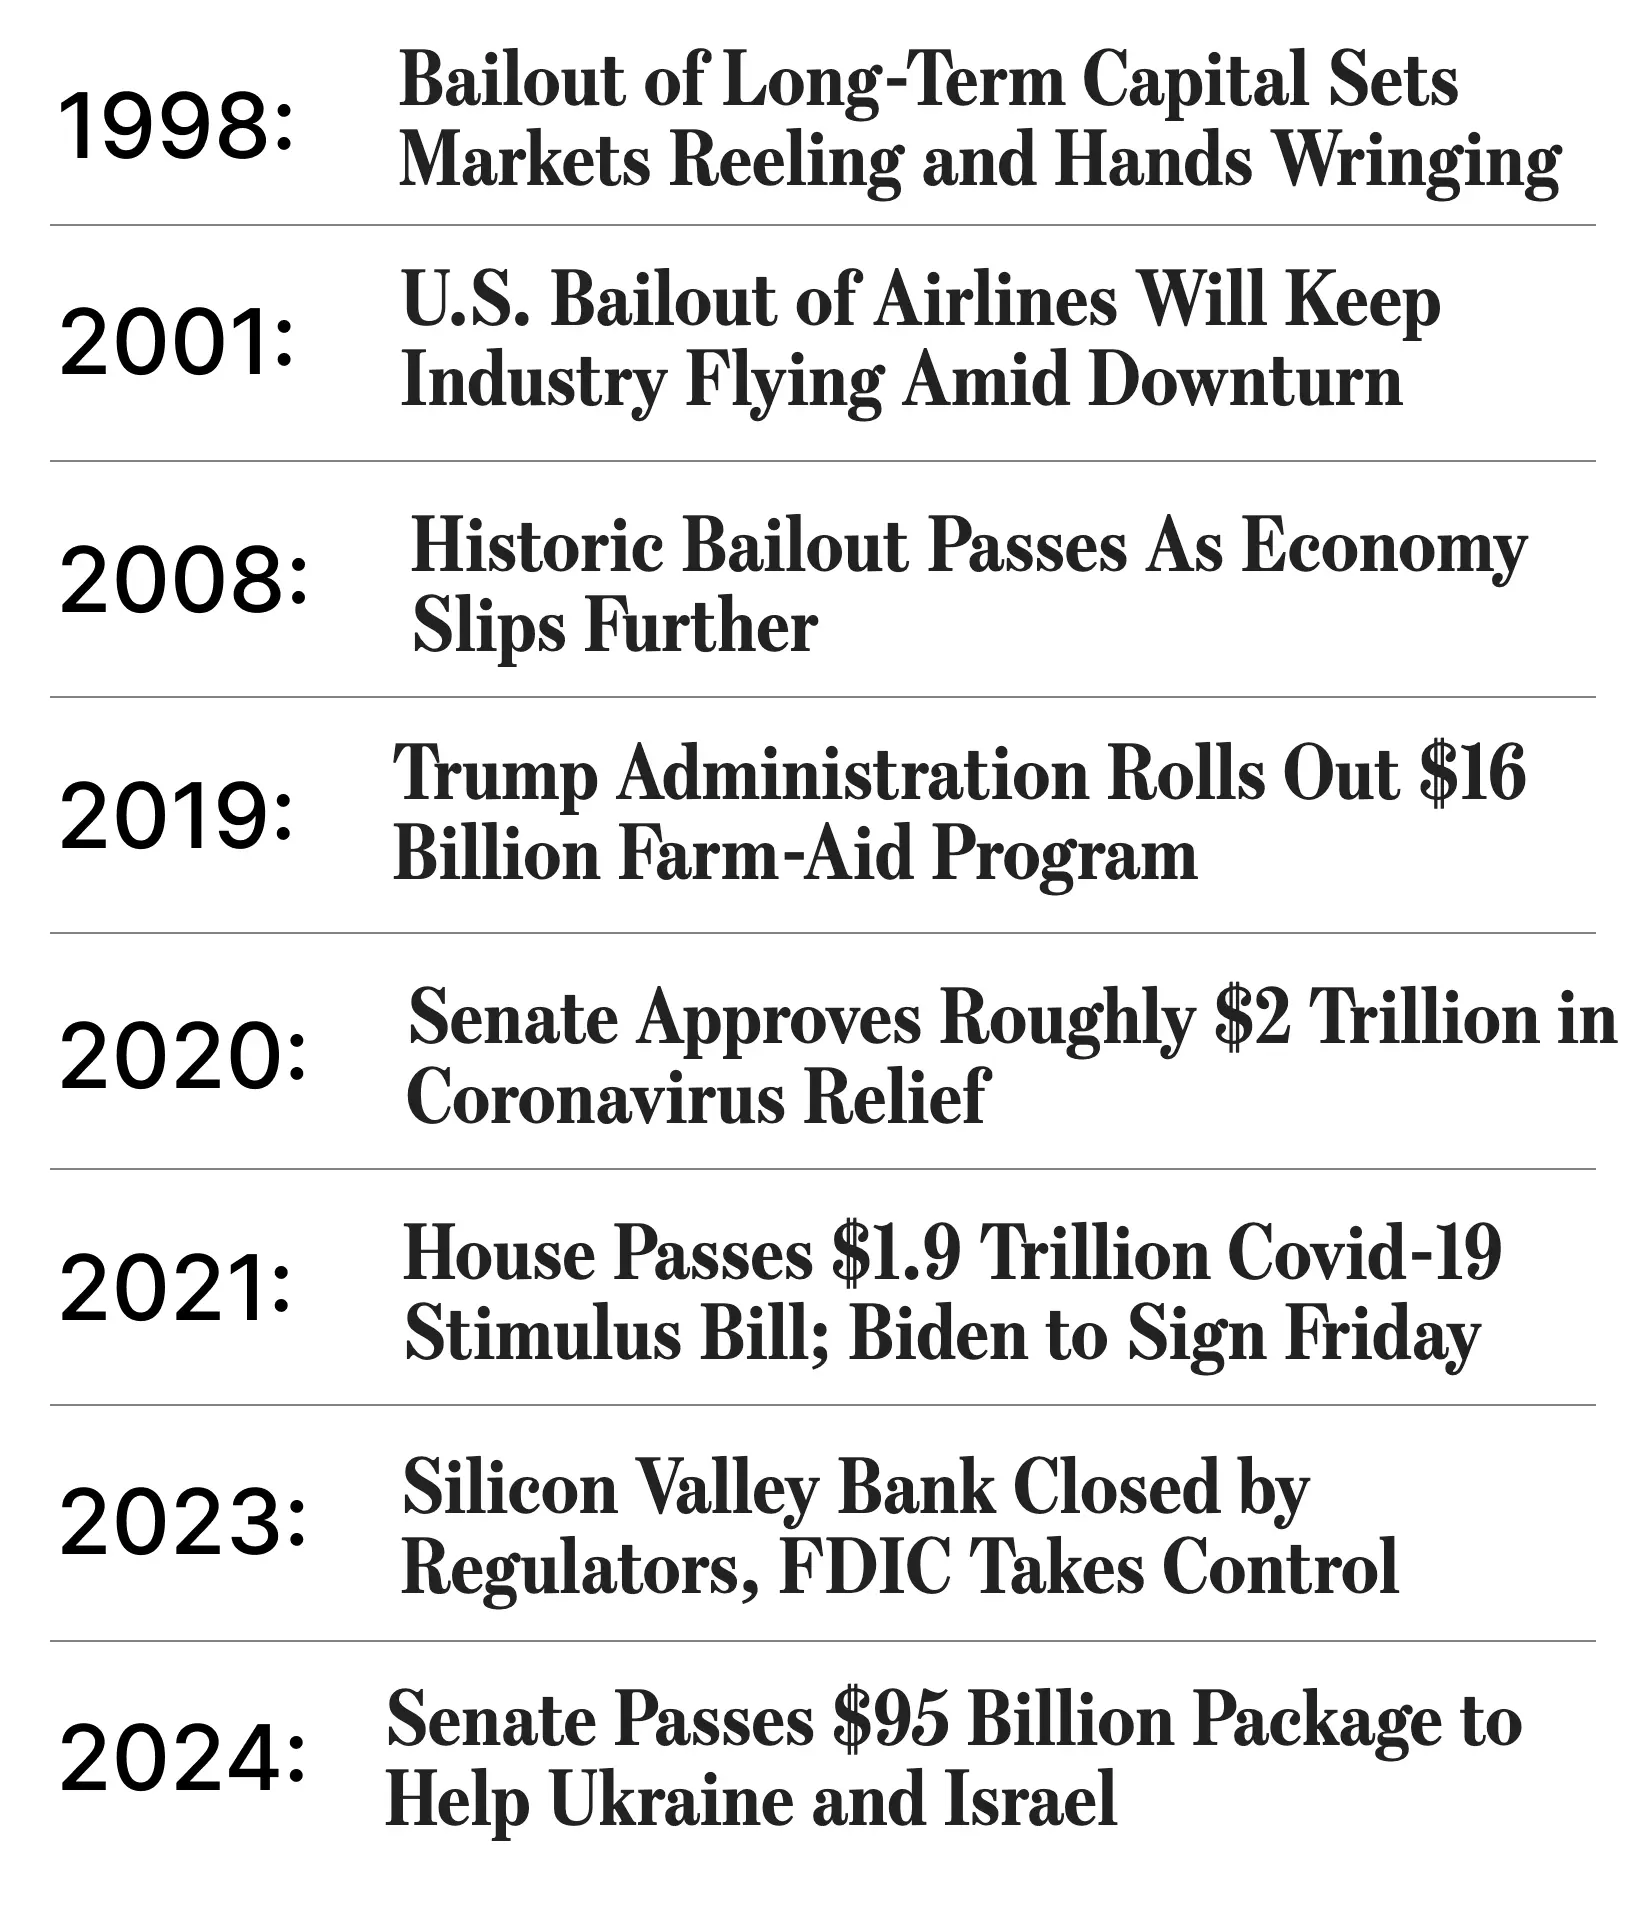
While printing money is a quick and easy way to address economic crises, its effects are temporary and often create deeper distortions over time.
When the government overspends, the resulting inflation pushes up asset prices such as stocks and real estate, which are typically owned by the wealthy.
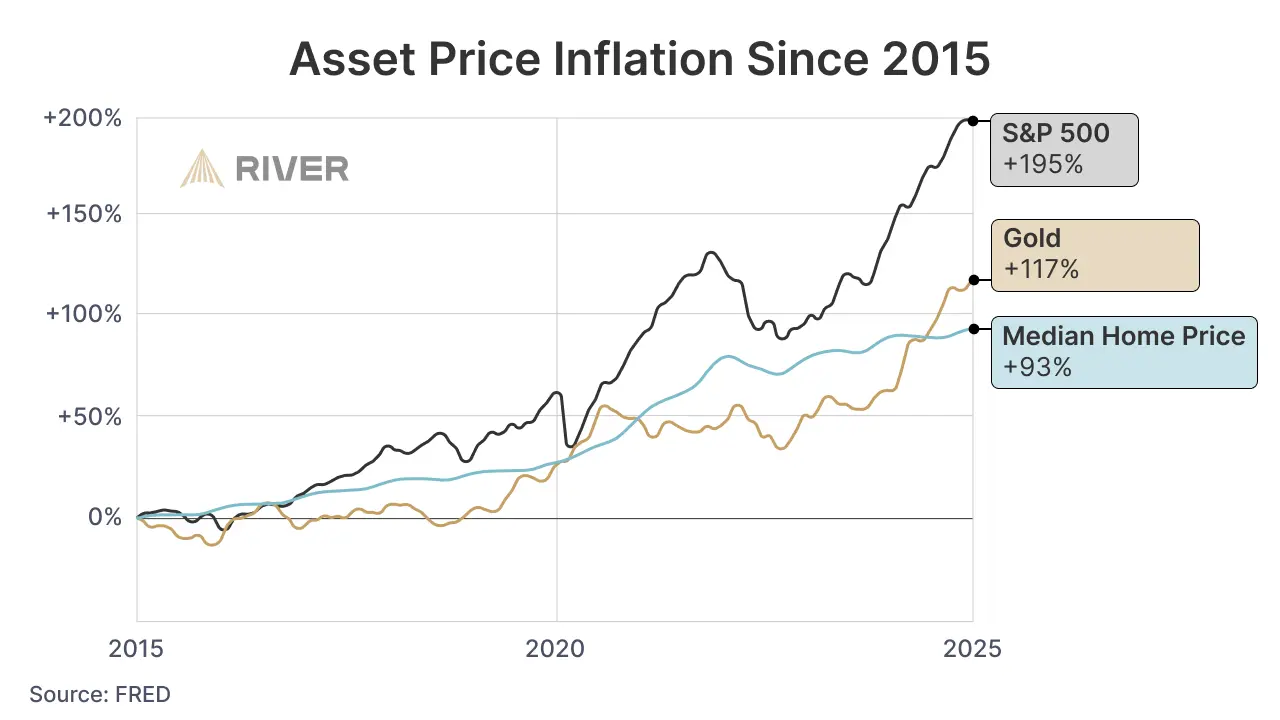
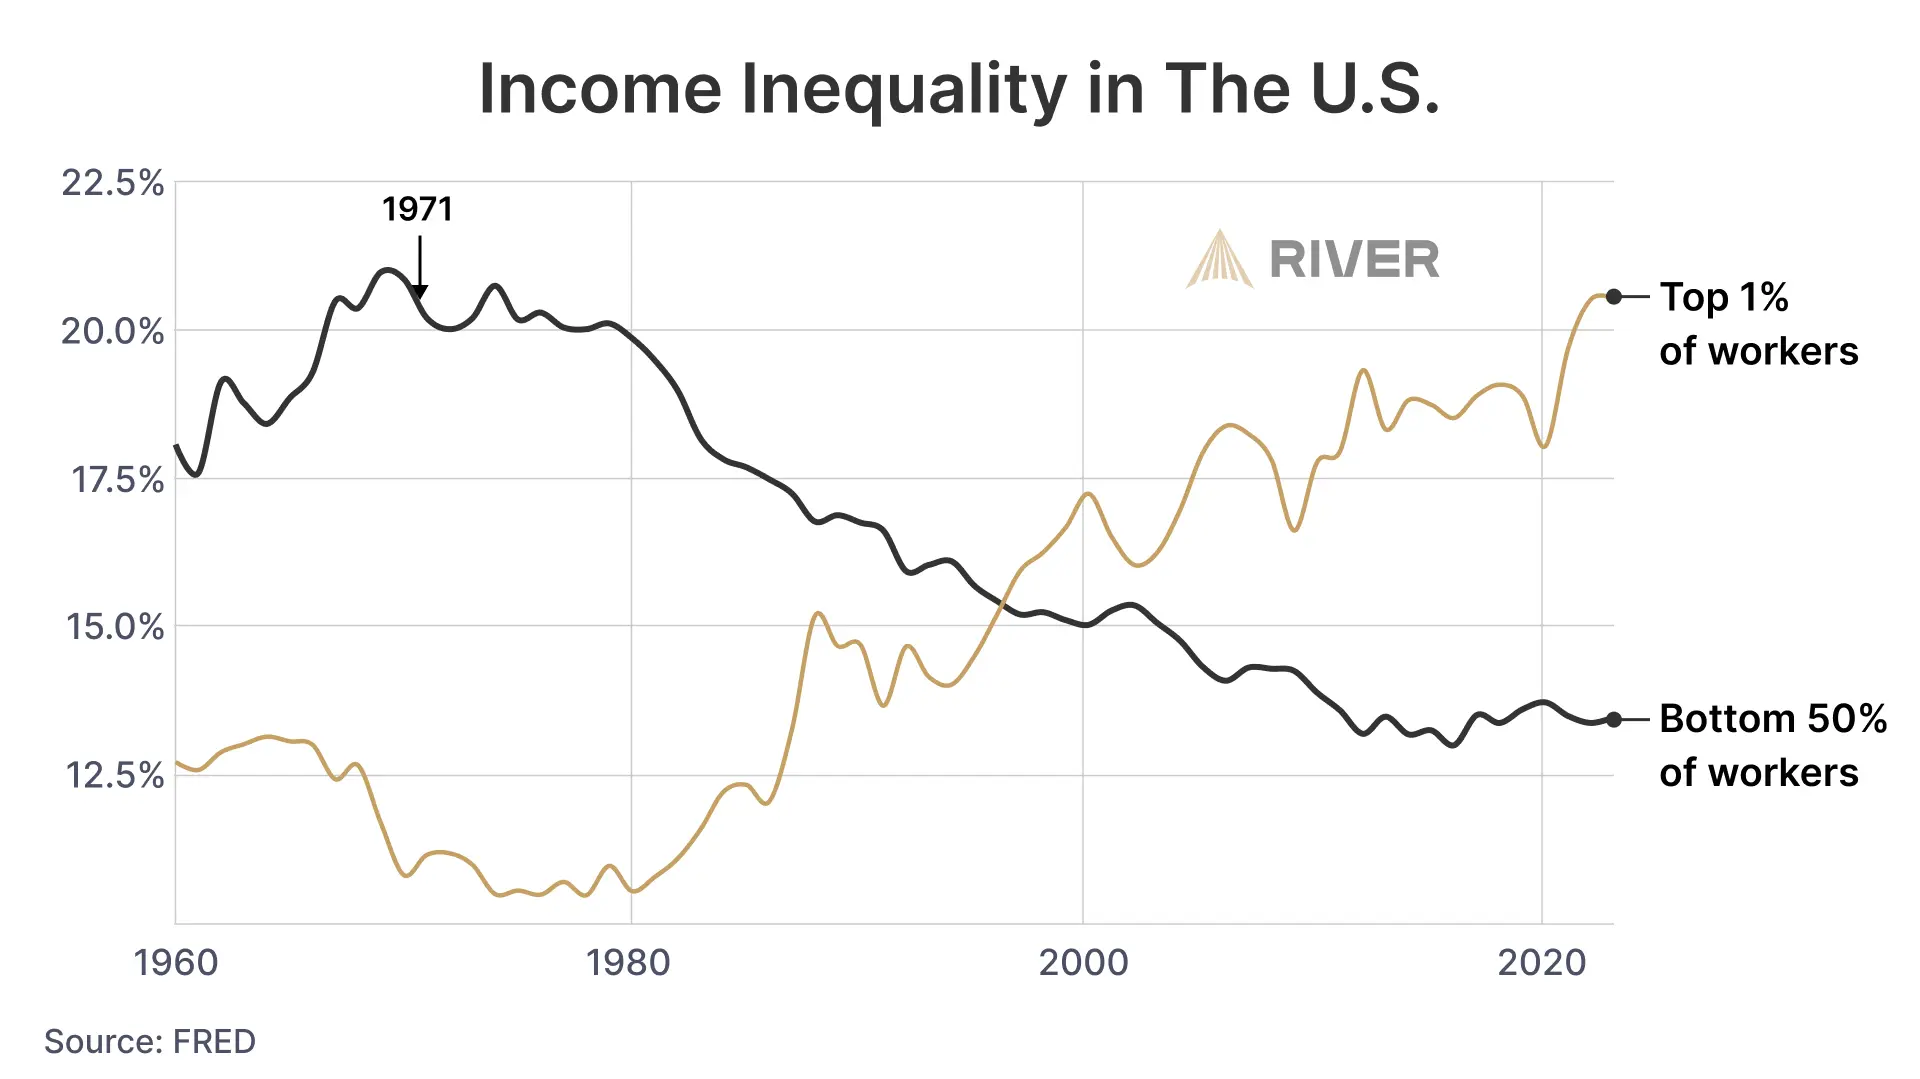
When new money is injected into an economy, its effects are felt by different people and industries at different times, and tend to widen income and wealth inequality even as they aim to stabilize the economy. This phenomenon, known as the Cantillon Effect, distorts relative prices and benefits certain parties while disadvantaging others.
The Long-Term Effects of Fiat Currency on the Individual
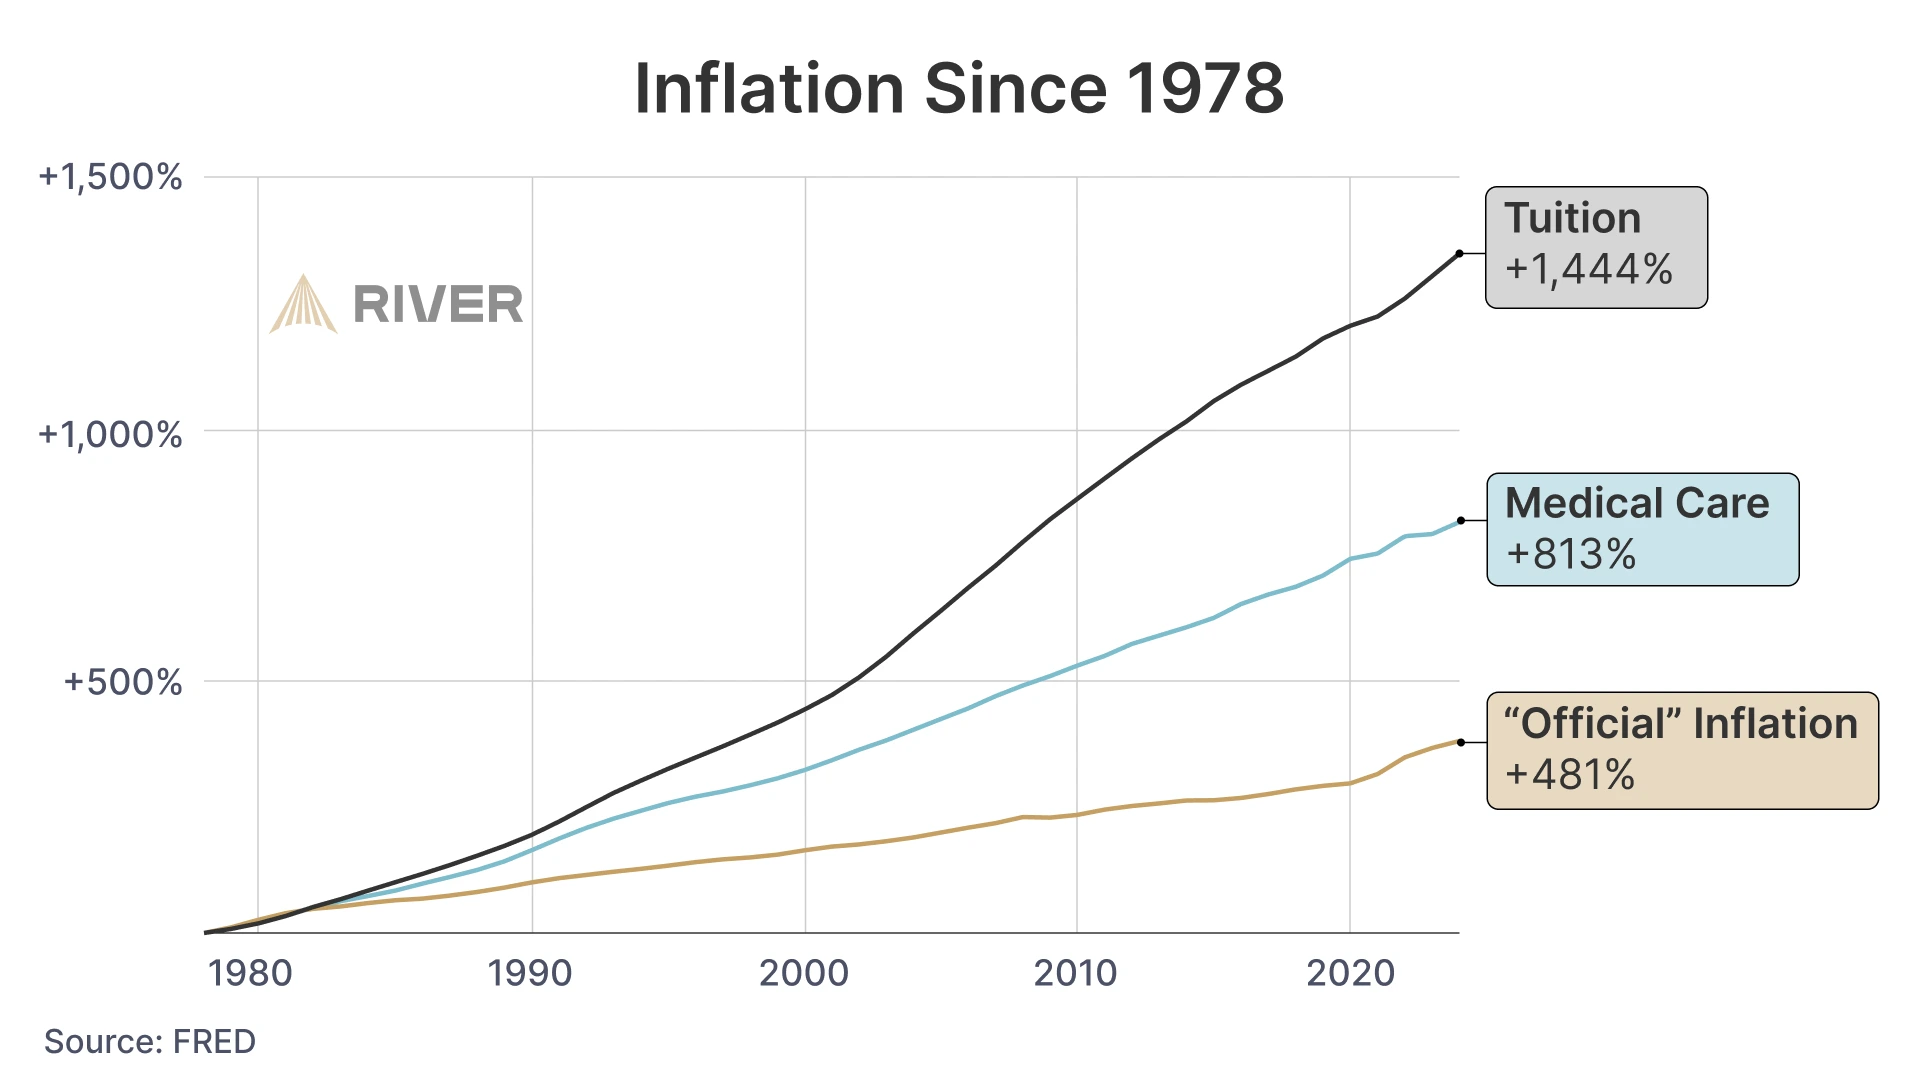
For individuals, the most tangible consequence of the fiat currency system is that the cost of living steadily rises over time.
Since 1971, official U.S. inflation has averaged 4.0% per year. However, the true rate of monetary debasement has been closer to 6.9% annually. Home prices have grown at an average of 5.4% per year, and the costs of essential goods and services, such as healthcare and education, have far outpaced the official inflation rate. Over decades, these effects dramatically erode purchasing power and make it more difficult for individuals to keep up, let alone build up any savings.
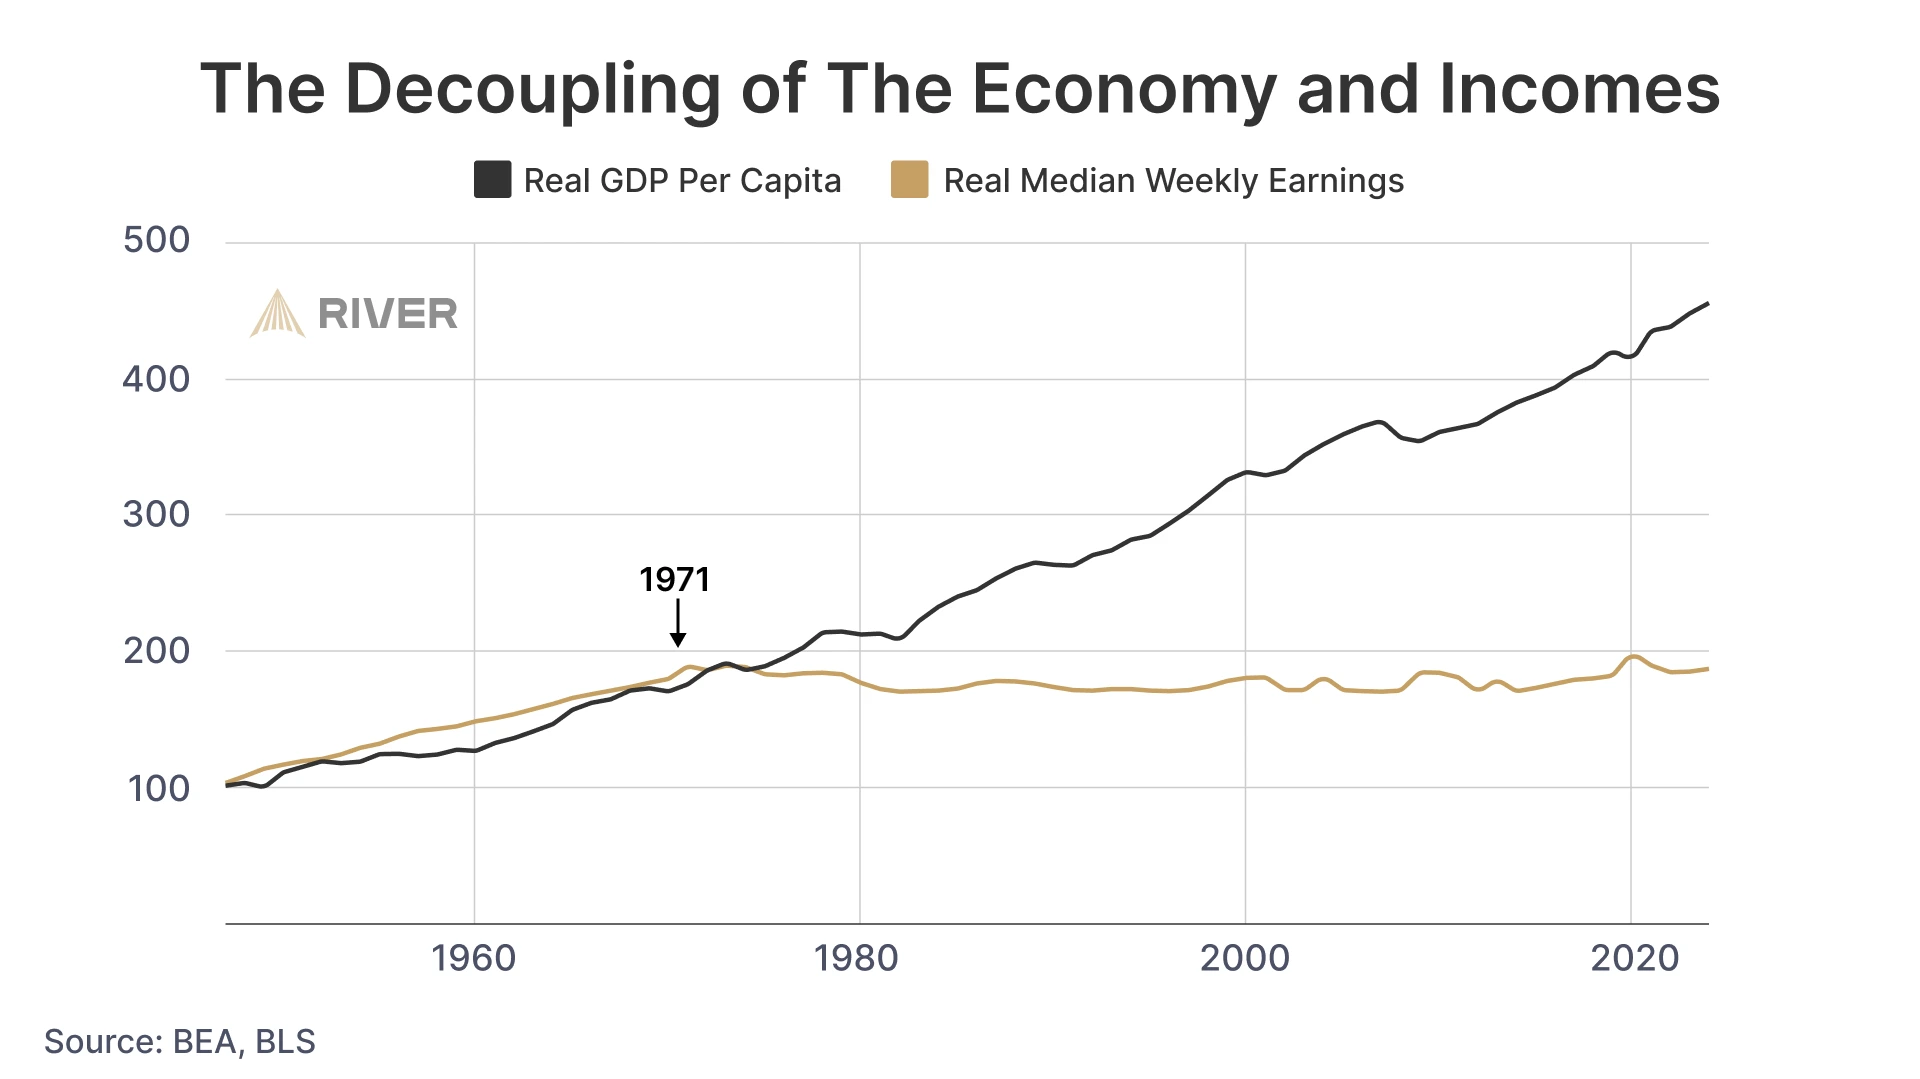
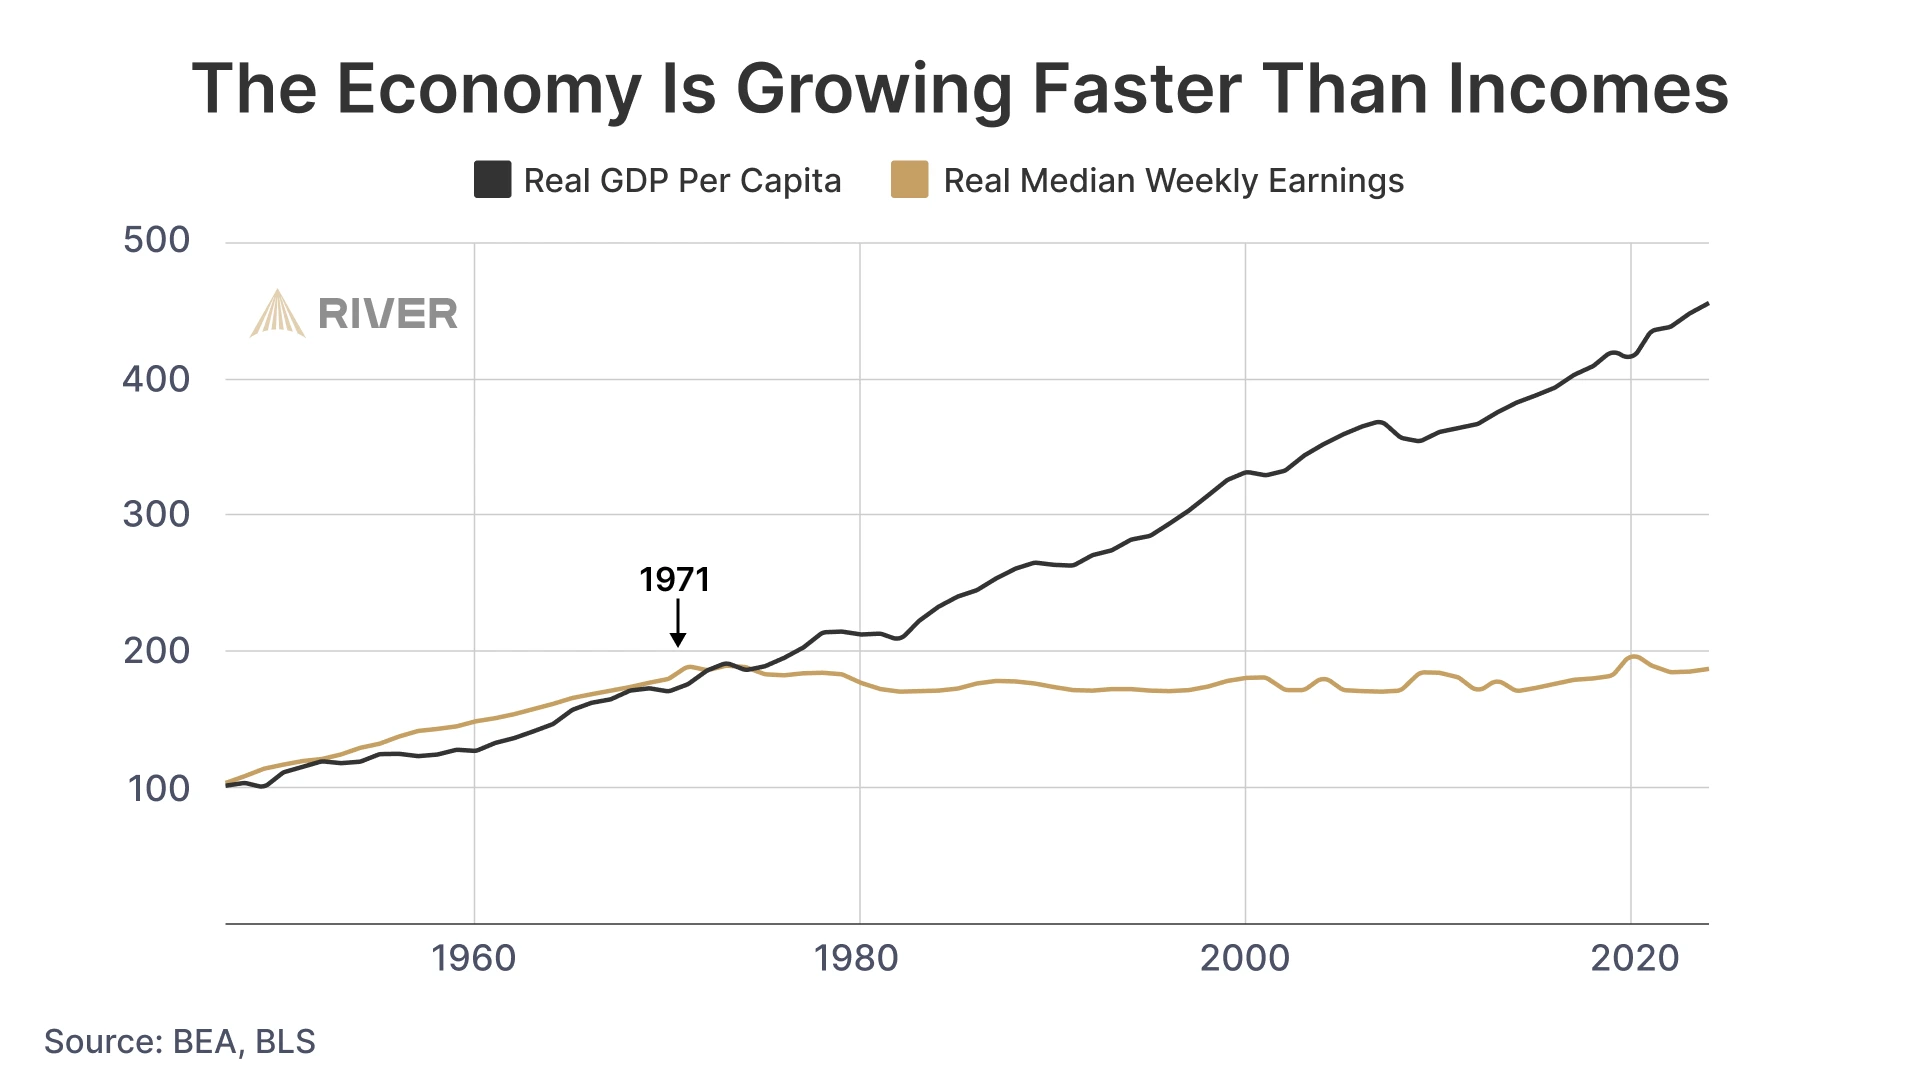
Furthermore, as American jobs were increasingly offshored and large corporations gained greater economic power, individual incomes stopped keeping pace with economic growth. Since 1971, wages for the average worker have largely stagnated, even as the overall economy has expanded significantly.
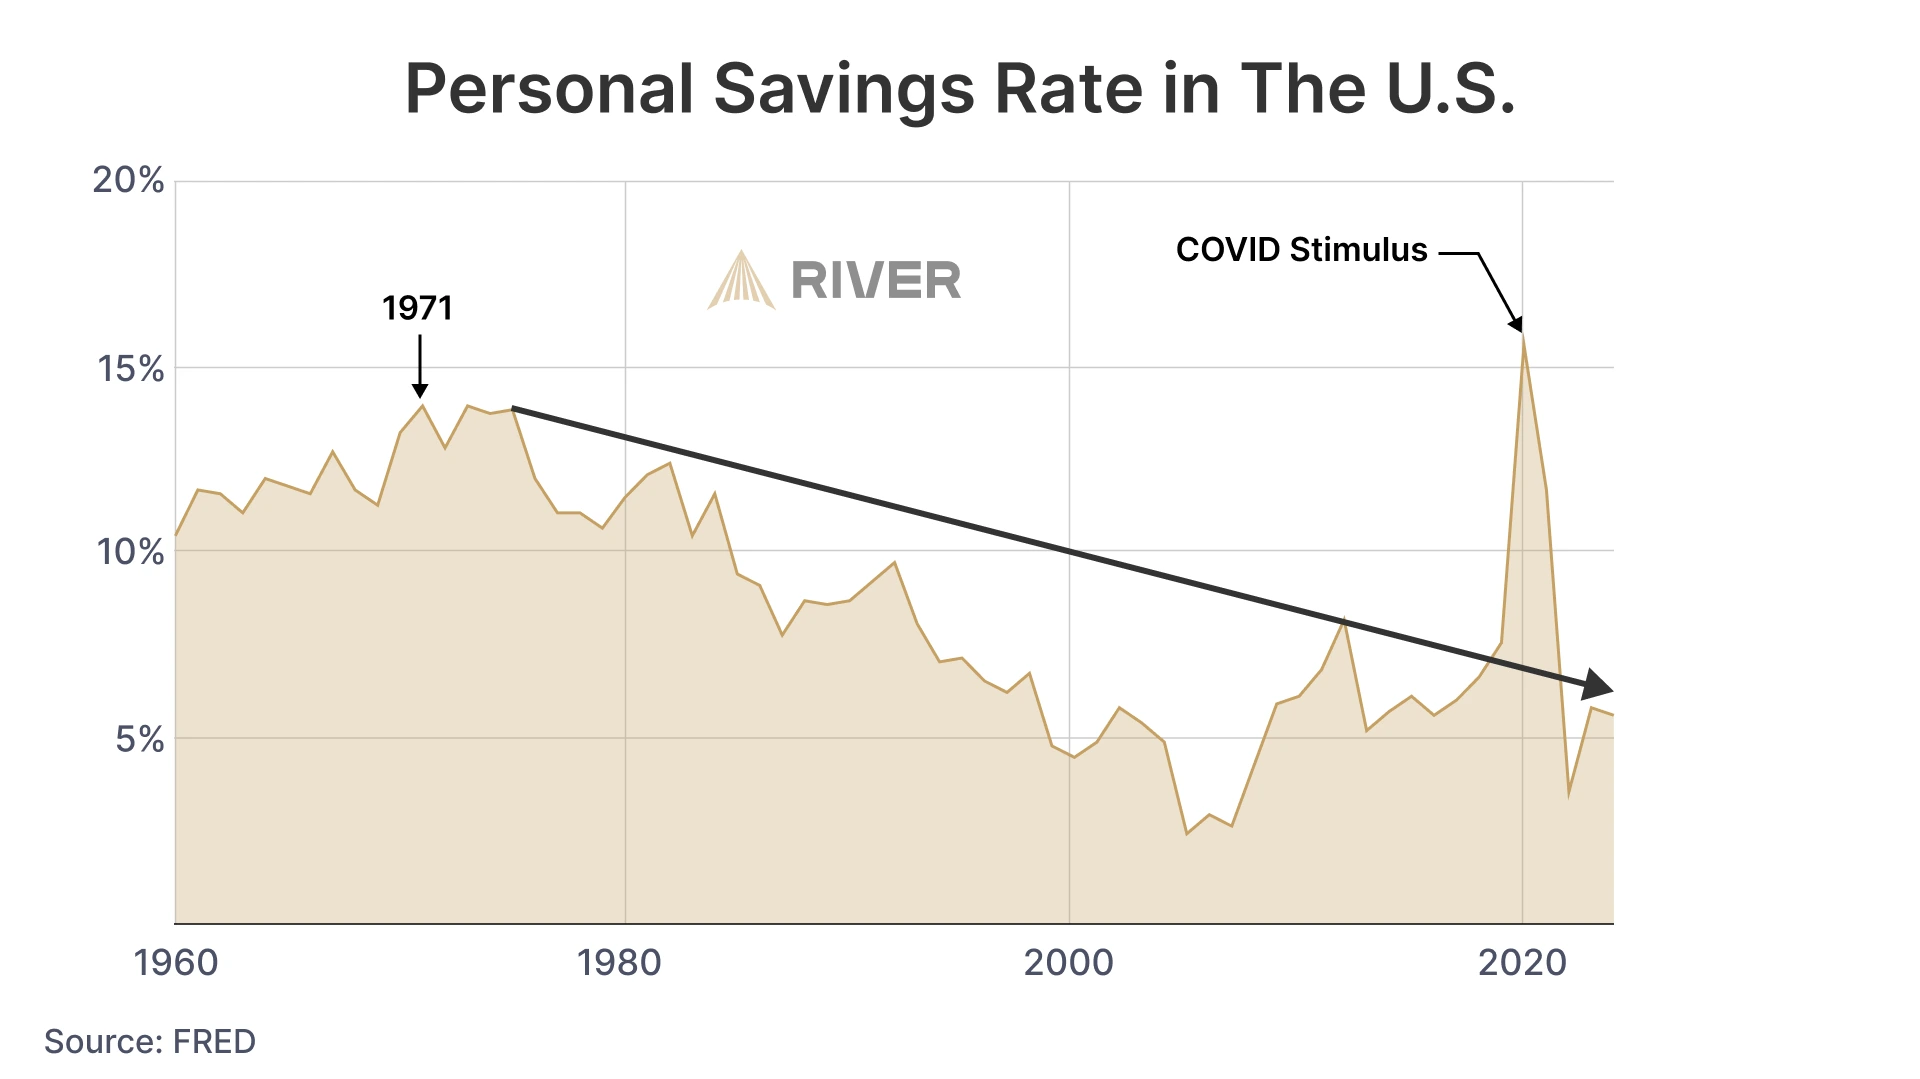
As a result of rising living costs and stagnant wages, individuals have found it increasingly difficult to save money.
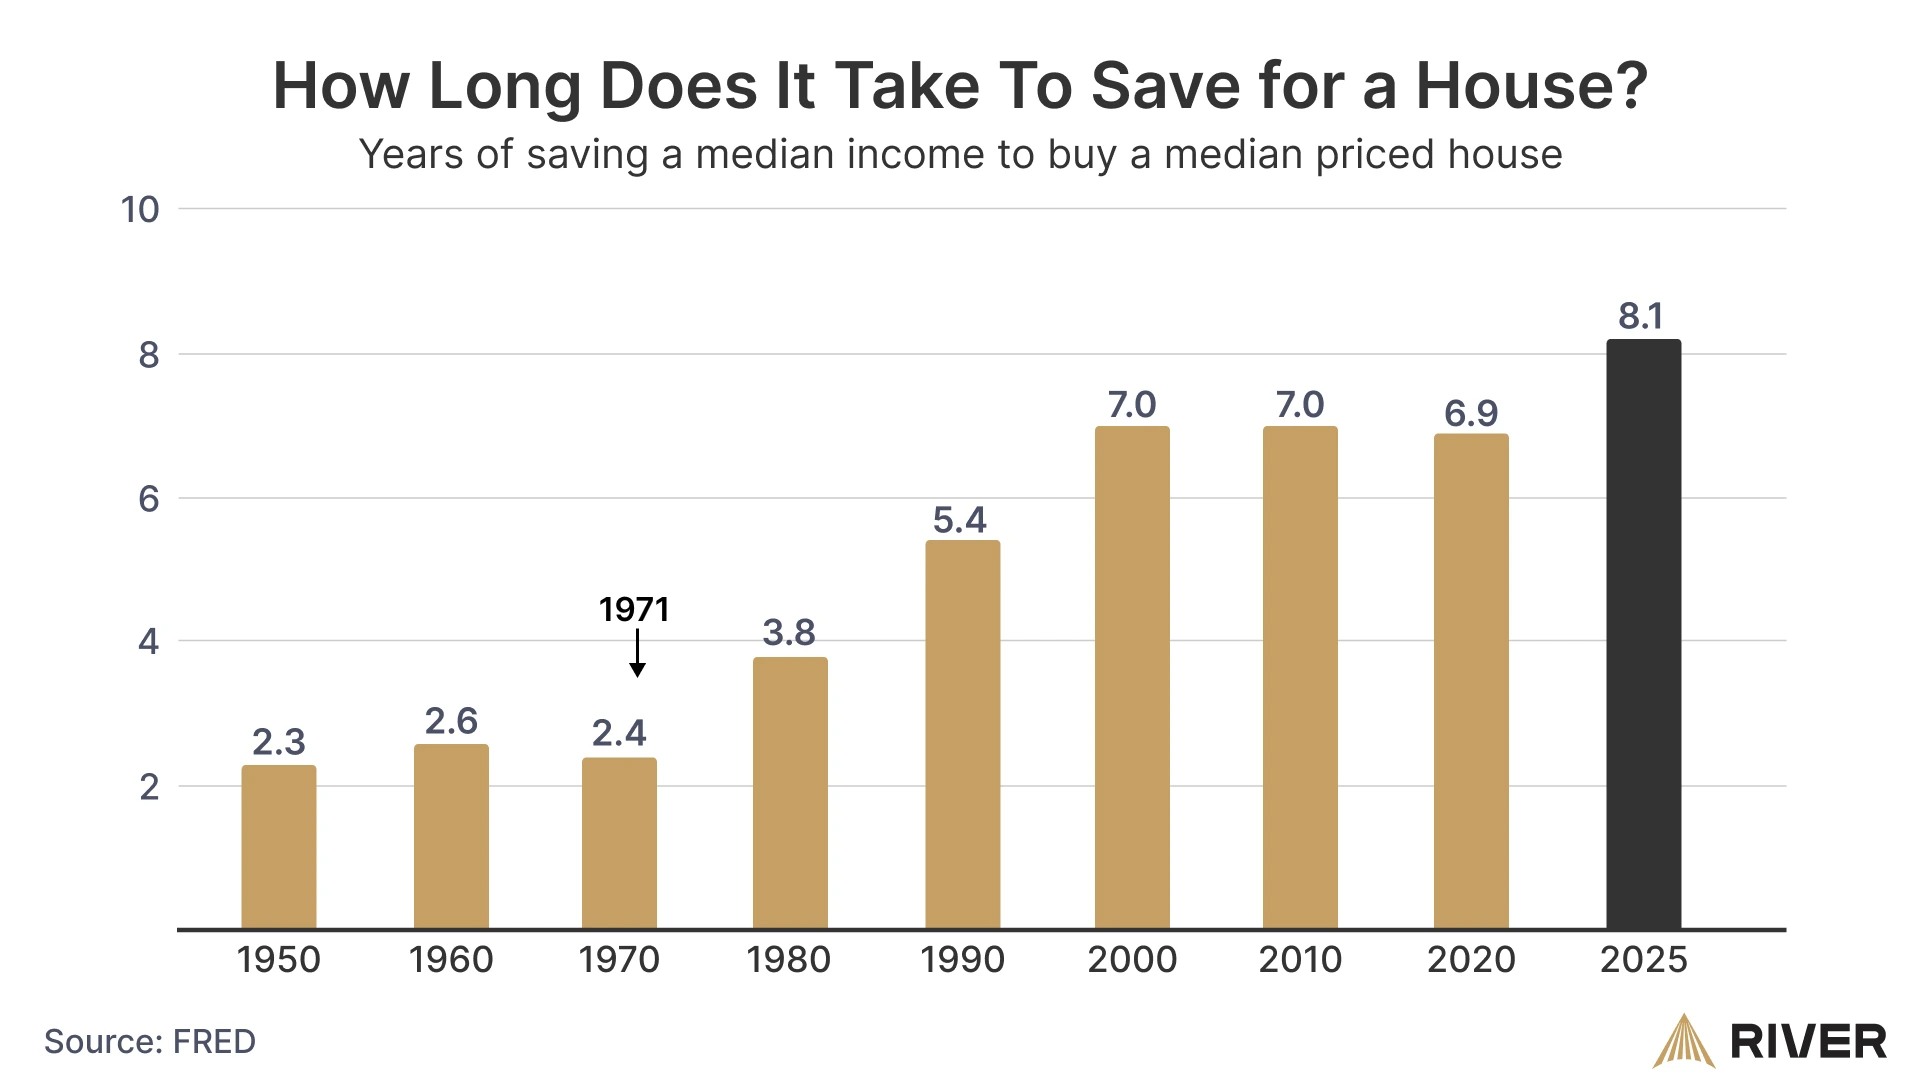
Purchasing a home has become increasingly difficult for average Americans.
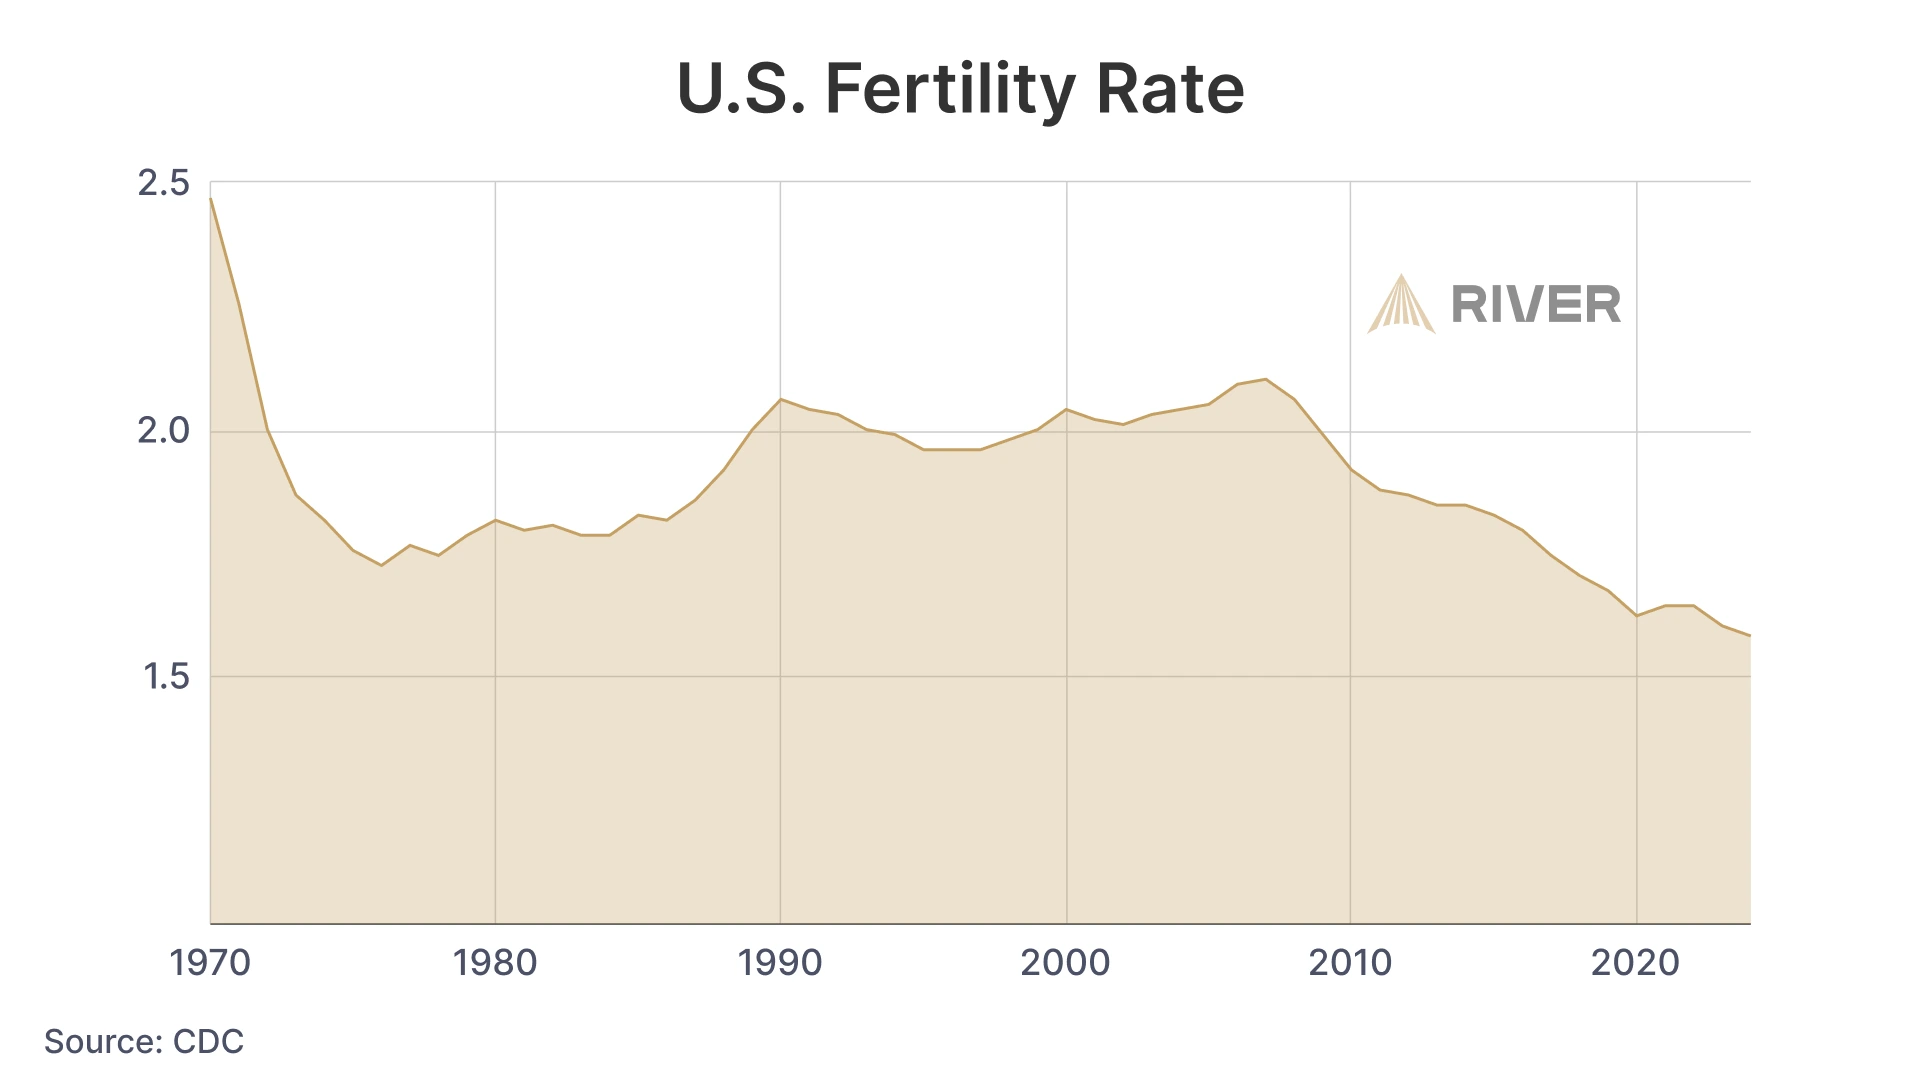
This is despite the fact that, since 1971, the number of households requiring both spouses to work has increased by 50%. This shift helps explain the declining U.S. fertility rate, as two in five women cite financial concerns as the primary reason for not having children.
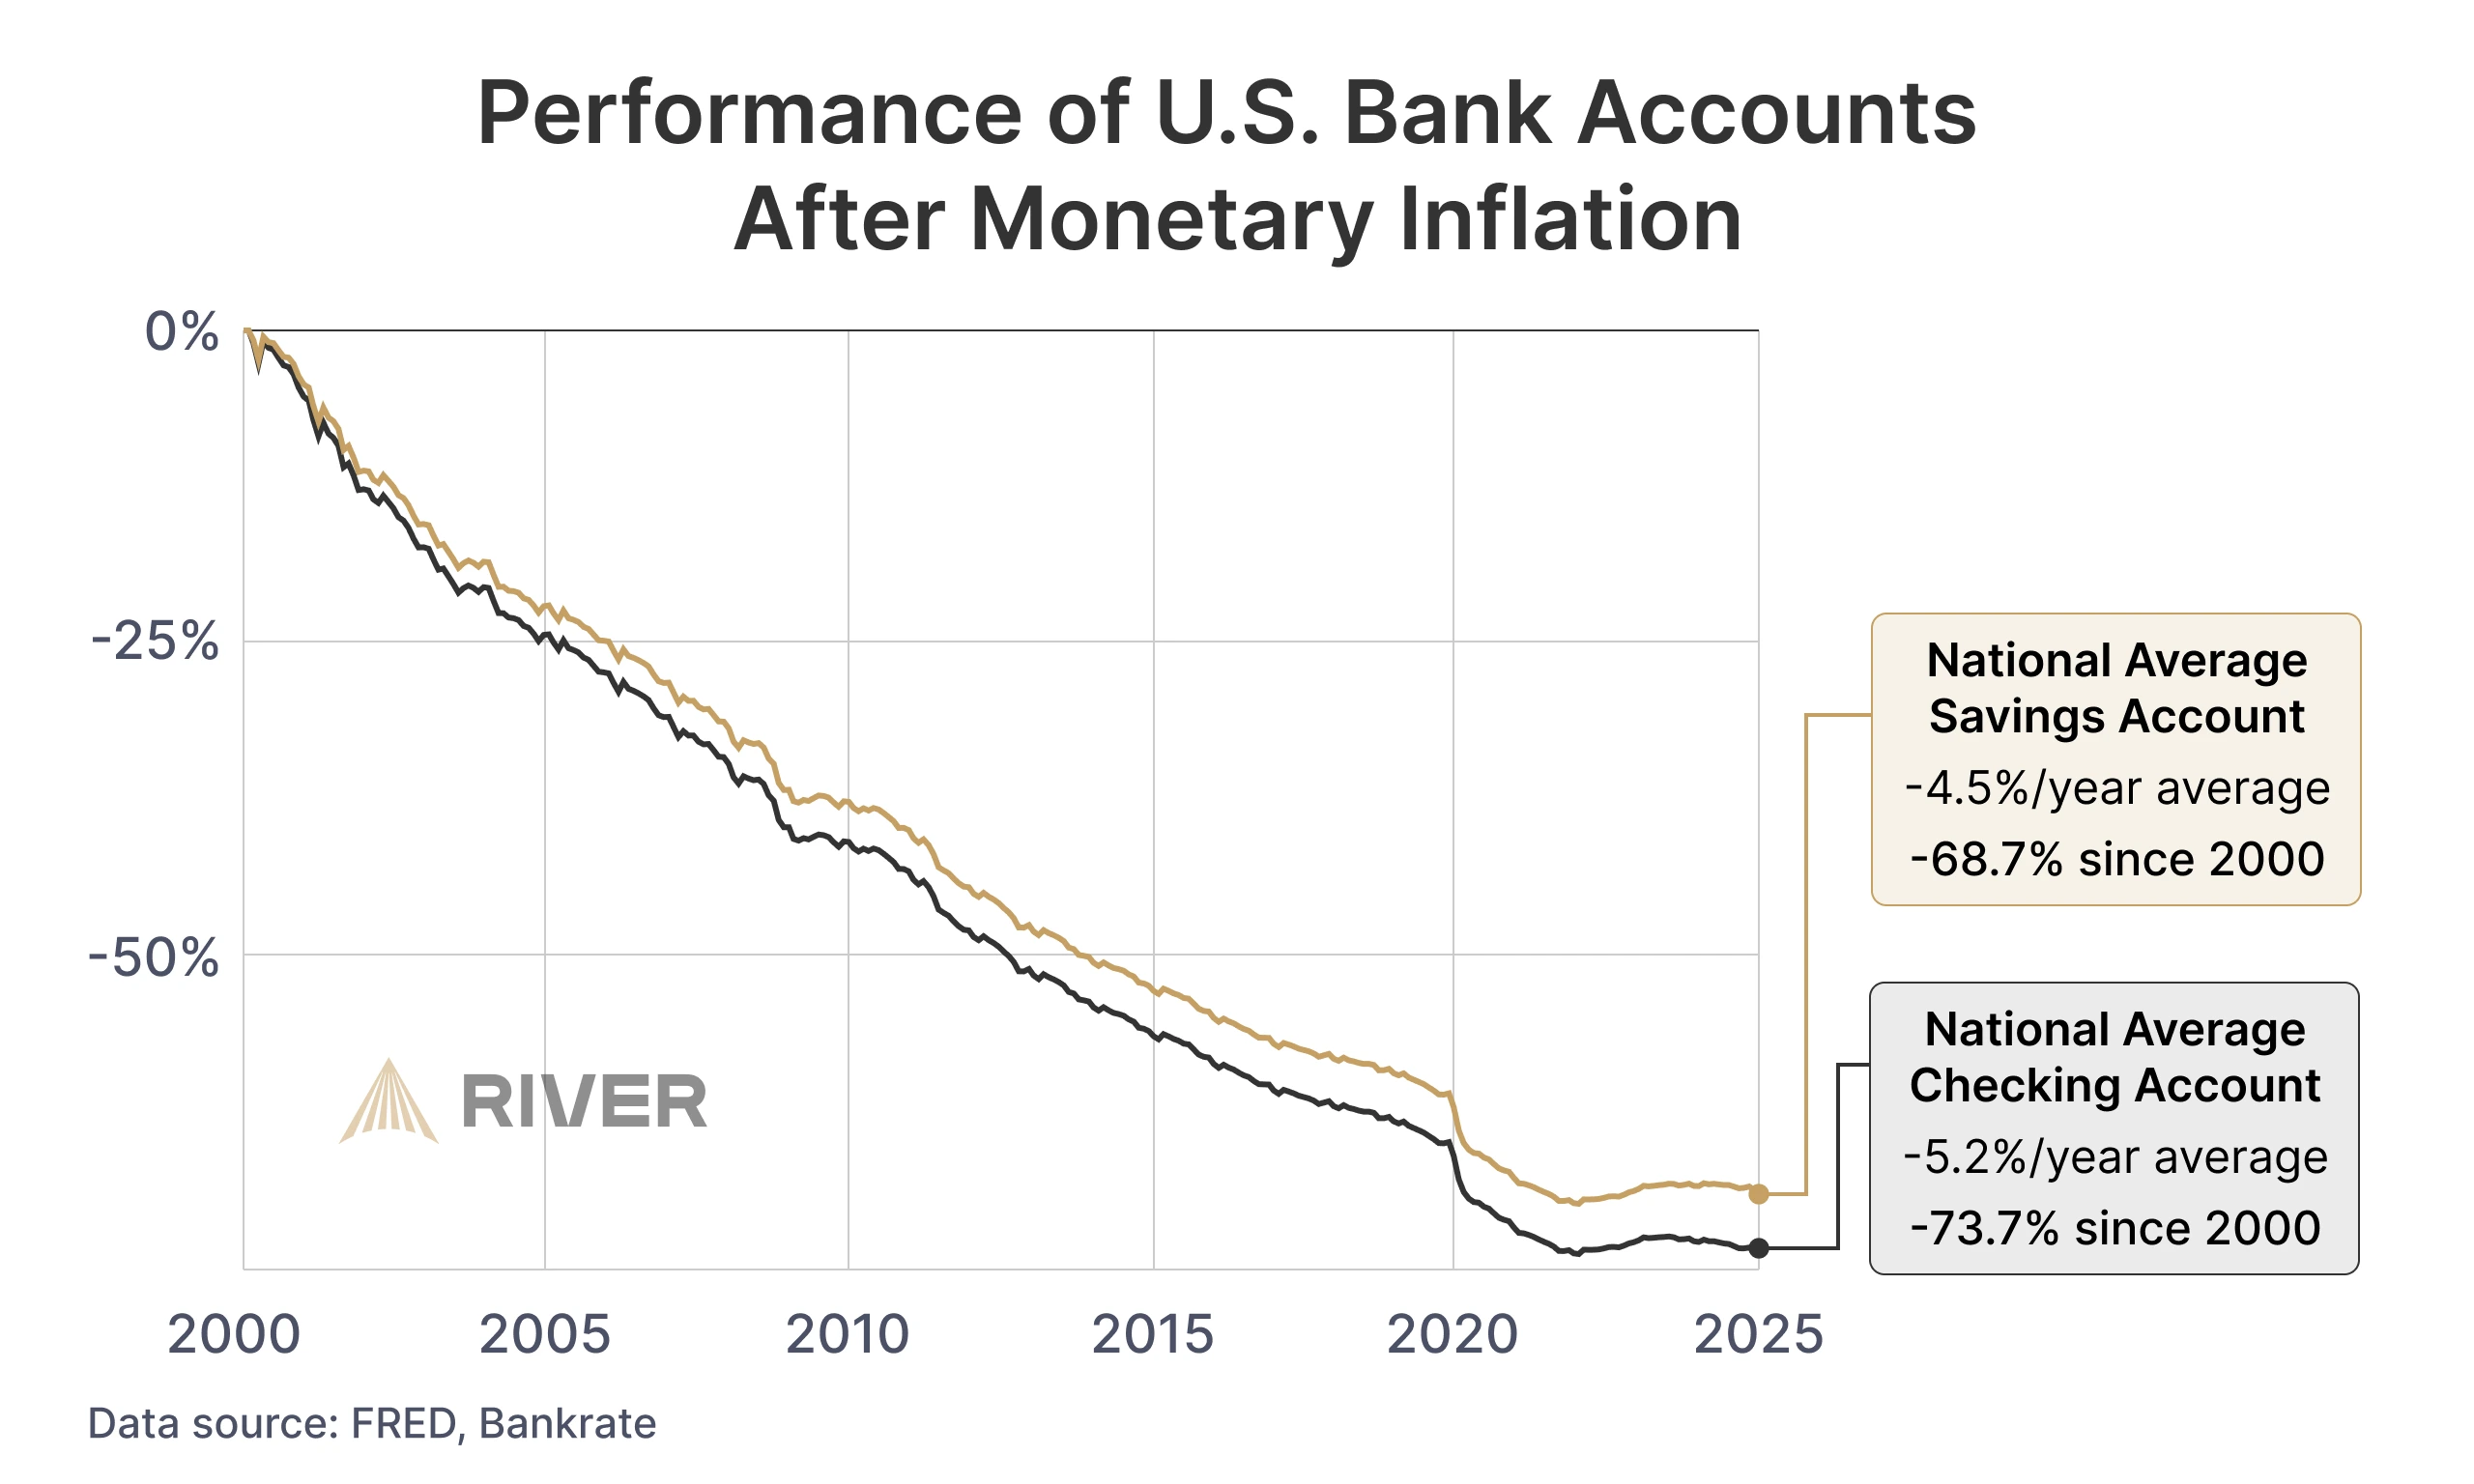
Lastly, because the dollar loses value each year, people are forced to invest their savings in increasingly complex portfolios of stocks and bonds just to preserve their purchasing power. Since 2000, the real value of the average U.S. savings account has been eroded by nearly 70% due to inflation.
How You Can Protect Your Savings From Inflation
Planning for the future can feel daunting in a world where saving is difficult, homeownership seems out of reach, and cash steadily loses value.
A good first step is to educate yourself on how different assets respond to inflation and develop a strategy to regain control of your financial future through responsible investing.
Bonds, for example, do not protect against inflation and typically lose value during inflationary periods. Stocks and real estate are typically more resistant to inflation, but they can be expensive to access and challenging to navigate during periods of economic uncertainty.
Today, bitcoin has emerged as a preferred store of value in an inflationary environment. Unlike the U.S. dollar, it has a fixed supply and has historically appreciated over time. Investors can start with as little as $1, gradually building their holdings without worrying about debasement or sudden increases in supply.
You can start learning more about bitcoin in our short introductory course, Bitcoin in 21 Minutes.
