What Are Candlestick Charts?
Candlestick charts originated in Japan in the 1700s when a rice farmer noticed that the rice market and price were heavily influenced by the emotions of traders. Therefore, a candlestick chart depicts price movements in a given time period.
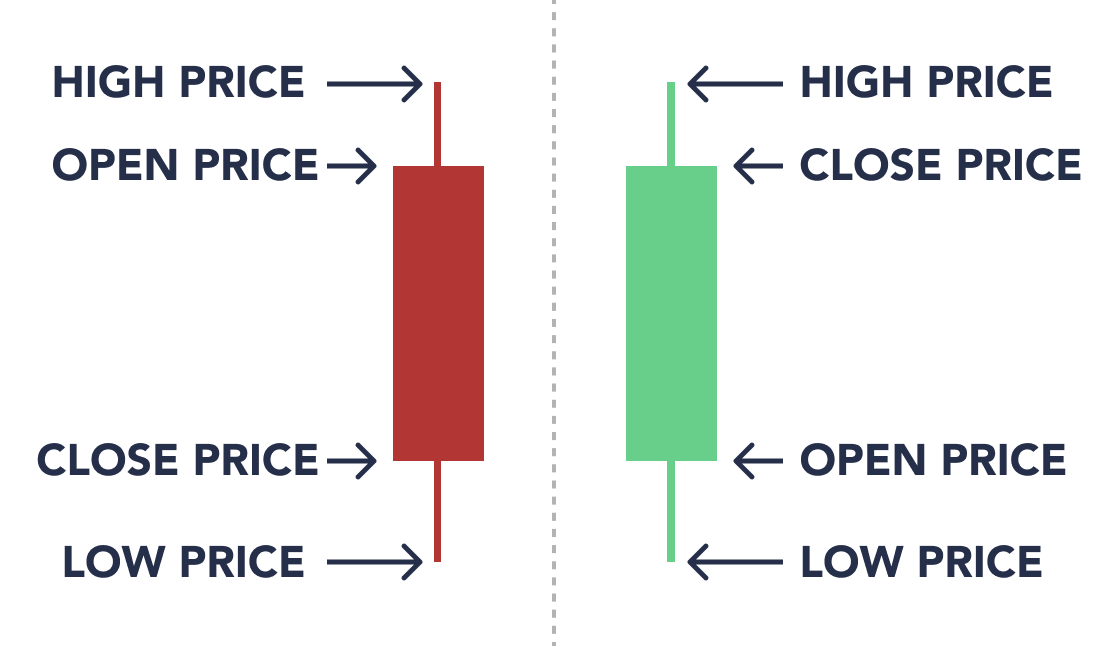
Candlestick charts are used by traders to determine future price movements based on historical data of price movements, and are commonly referenced in technical analysis and algorithmic trading. Through market psychology analysis, candlestick charts can provide some insight into the emotions of market participants, and they show four price points during a specific time period: open, close, high, and low.
Candlestick Chart Components
A candlestick chart can be viewed over weeks or months, as well as in shorter time periods like hours or minutes. A candlestick chart shows the open, high, low, and close price for the specified time period. The “shadows” or wicks of a candlestick chart depict the high price and the low price. A short upper wick on a shaded candle signifies that the high price was close to the open price.
The long, thin wicks of the candlestick extend from a wide section known as the real body. The real body represents the price range between the open and close of that time period’s trading. When the real body has a black or red fill, it means the close was lower than the open. If the real body is empty or green, it means the close was higher than the open.
The difference between the opening and closing prices, the length of the wicks, and the shading or the real body, or lack thereof, all provide traders with information about the demand and supply of the asset.
Candlestick Chart Patterns
Candlesticks are created by positive or negative changes in the asset price. At first glance, these price movements can appear to be random. However, candlesticks often form patterns that investors use for analysis or traders use to assess trading strategies. There are many candlestick patterns, but they are typically separated into bearish and bullish patterns.
Bullish patterns indicate to traders that the price is likely to rise, and bearish patterns indicate that the price is likely to fall. Like any price data, candlestick chart patterns represent historical tendencies. They do not provide any guarantees about what future prices and market movement will look like.
Bearish Patterns
A bearish pattern occurs when a long red real body dominates a small green real body, signifying that sellers outnumber buyers and the price has fallen. Therefore, sellers are dominating the market and the price is in decline or could continue to decline.
A bearish evening star pattern, also known as a topping pattern, occurs when the last candle in the pattern opens below the previous day’s small real body, which is either red or green. A bearish evening star pattern shows that buyers have slowed and the sellers are taking control of the market, possibly leading to a decline in the asset price.
Bullish Patterns
A bullish pattern occurs when a long green or hollow real body dominates a small red or filled real body, indicating that buyers are outpacing sellers. When buyers dominate the market, the price could rise.Within a downtrend or bearish pattern, bullish reversal patterns can form. These reversals are not considered bullish, only a continuation pattern, unless there is upward price movement and higher trading volume.
Key Takeaways
- Traders use candlestick charts to analyze historical price movement and identify patterns.
- A candlestick chart can indicate the emotional sentiment of actors in the market.
- Candlestick charts are used in algorithmic trading and technical analysis.